Storyline e-meeting for GENIQUEST
Randy and Chad - Dec. 12, 2007
Outline of process:
Students run QTL scan on genome - identify areas of potential interest
Each area of interest is marked by a confidence interval. These confidence intervals indicate the area along a chromosome that is related to the selected phenotype within the desired degree of confidence. For example, a student doing a QTL scan for high HDL cholesterol levels might find a high correlation with a specific section of chromosome 3. This section, perhaps 1/8 of the length of the chromosome ![]() , would be 95% certain to include the gene responsible for the high HDL cholesterol levels. Doing this is not the end of a search, however, as the area pinpointed may involve thousands of individual genes (nucleotidesSNPs?).
, would be 95% certain to include the gene responsible for the high HDL cholesterol levels. Doing this is not the end of a search, however, as the area pinpointed may involve thousands of individual genes (nucleotidesSNPs?).
In order to pinpoint the gene responsible, several other techniques may be at the student's disposal. One of these involves using additional QTL scans of other strains and overlapping the areas implicated by the scans. If QTL scans of two strains exhiiting the same phenotype indicate overlapping high confidence intervals on the same chromosome, the candidate area on that chromosome is narrowed down to the area of overlap. By repeating this process for multiple scans, students may be able to narrow the candidate area to an interval containing a manageable number of genes.
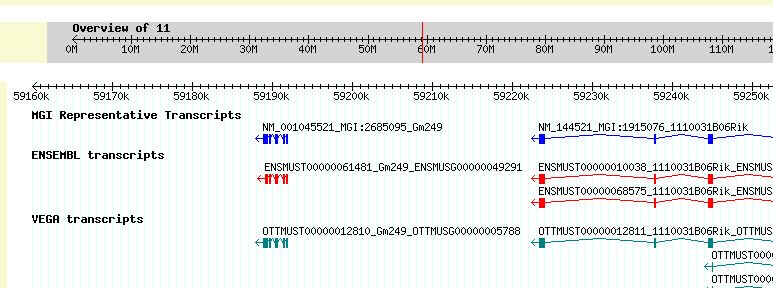
Once students have narrowed the candidate area to one containing a manageable number of genes, they can investigate the known information about genes in that candidate area to look for potential "matches" with studied conditions related to the phenotype they are considering. Entering into a genome browser (such as GBrowse), the students can select the chromosome they are considering and select the interval along that chromosome they identified previously as a candidate interval. When they do so, the genome browser will display the genes within that candidate interval and allow students to find out more about these genes. Students will investigate each of the various genes under the candidate interval, looking for genes that have been implicated in previous studies as responsible for related phenotypes.
Narrowing candidate intervals further through selective breeding experiments
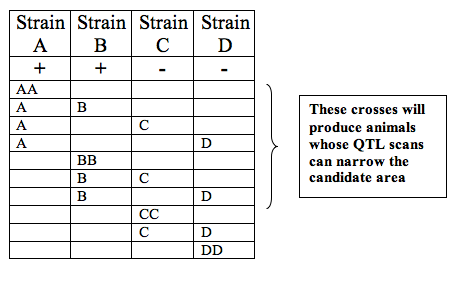
In a virtual environment permitting animals to be "bred" as desired, students may also be able to narrow the candidate area responsible for a phenotype by performing breeding experiments selectively. If a phenotype is present in some strains of an animal, but not others, a QTL scan may indicate a candidate interval too wide to be useful. By breeding the animals with others that do not exhibit this phenotype, students can create crosses that possess this phenotype and crosses that do not. By running one-QTL scans on those animals that possess the phenotype as a result of these crosses, students can generate confidence intervals for the location of the candidate area that are more specific. When overlaid on original scans, this information can help pin the candidate area down specifically enough for the student to move toward genome browsing. Additionally, using scans run on those animals that do not possess the phenotype may help narrow down the candidate area further.
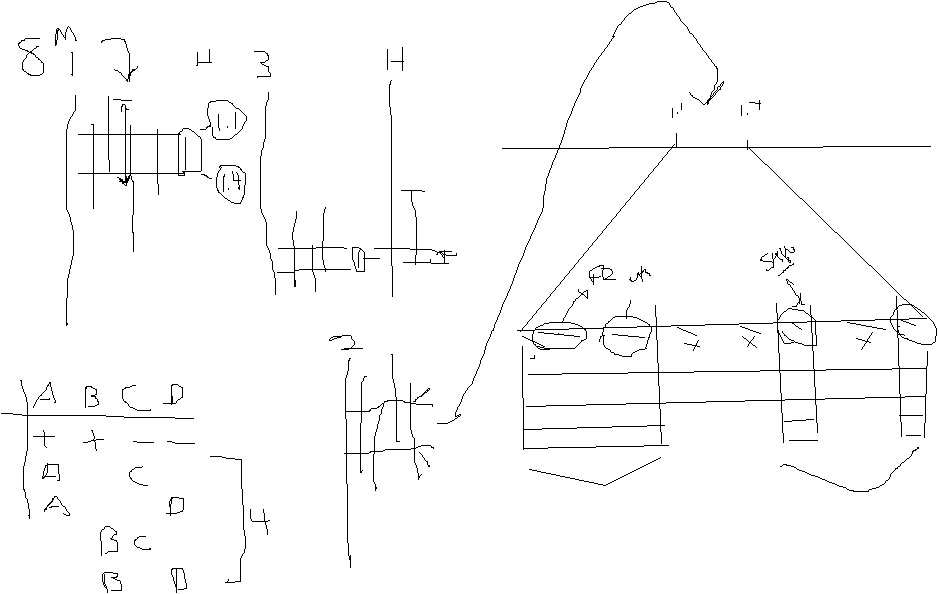
Barely comprehensible images from Dec. 12 emeeting whiteboard inserted below:
Image 1
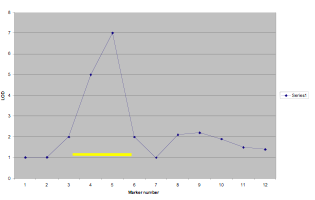
Image 2
Image 3